May 31, 2024 by Cyril Noirot
The Hill function and its role in modeling marketing response curves
Accurately modeling the response of consumers to advertising is crucial, as mentionned in previous article a well suited function is the Weibull cdf. Here we will present another effective method the Hill function, which helps capture the relationship between marketing execution metric and consumer response. This function is particularly known for its ability to produce S-shaped curves, which are excellent for modeling various types of response phenomena.
The Hill function
The Hill function originates from biochemistry, where it describes the saturation of ligand binding to a receptor. However, its application extends beyond biology, finding utility in economics, marketing, and other fields. The general form of the Hill function is:
$$ Hill(F,K,S) = \frac{F^S}{K^S +F^S} $$
where:
F is the frequency of the stimulus (e.g., the number of times a consumer is exposed to an ad) it can also be any marketing metric reflecting an activity (spend/grp/impressions).
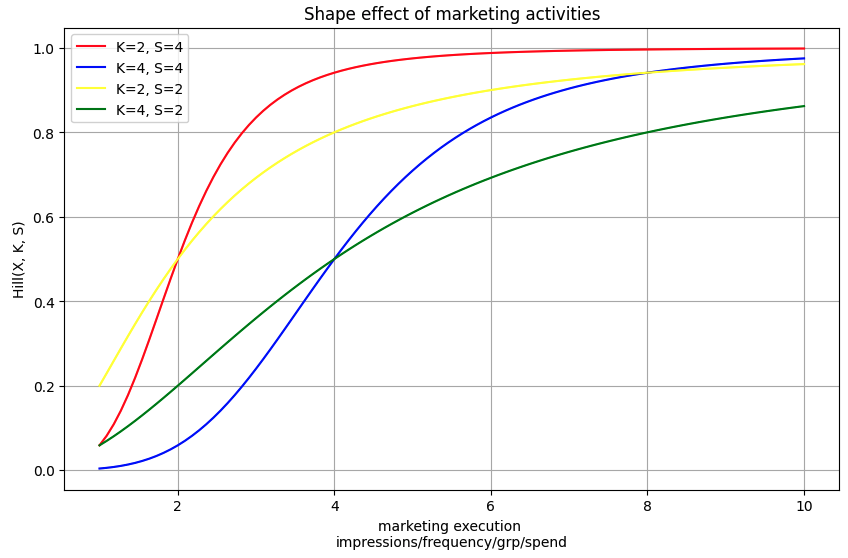
K is the half-maximal effective concentration, representing the frequency at which the response is half of its maximum.
S is the Hill coefficient, indicating the steepness of the curve.

Response curves with Hill function
In advertising, the Hill function can be used to model how consumers respond to varying frequencies of ad exposure. Here’s a step-by-step approach to applying the Hill function to create response curves
Define marketing execution range: Determine the range of ad exposures you want to analyze, usualy this is comming from your historical data. For instance, this could range from 1 to 10 exposures in case of frequency.
Set parameters: Choose appropriate values for K and S based on historical data or estimated impacts. These parameters will influence the shape and steepness of the response curve.
Compute response: Use the Hill function to calculate the response for each frequency value. This response represents the likelihood or extent of consumer action, such as making a purchase.
Plot the curve: visualize the response curve by plotting the computed responses against the corresponding chosen marketing execution.
Why the S-shaped curve?
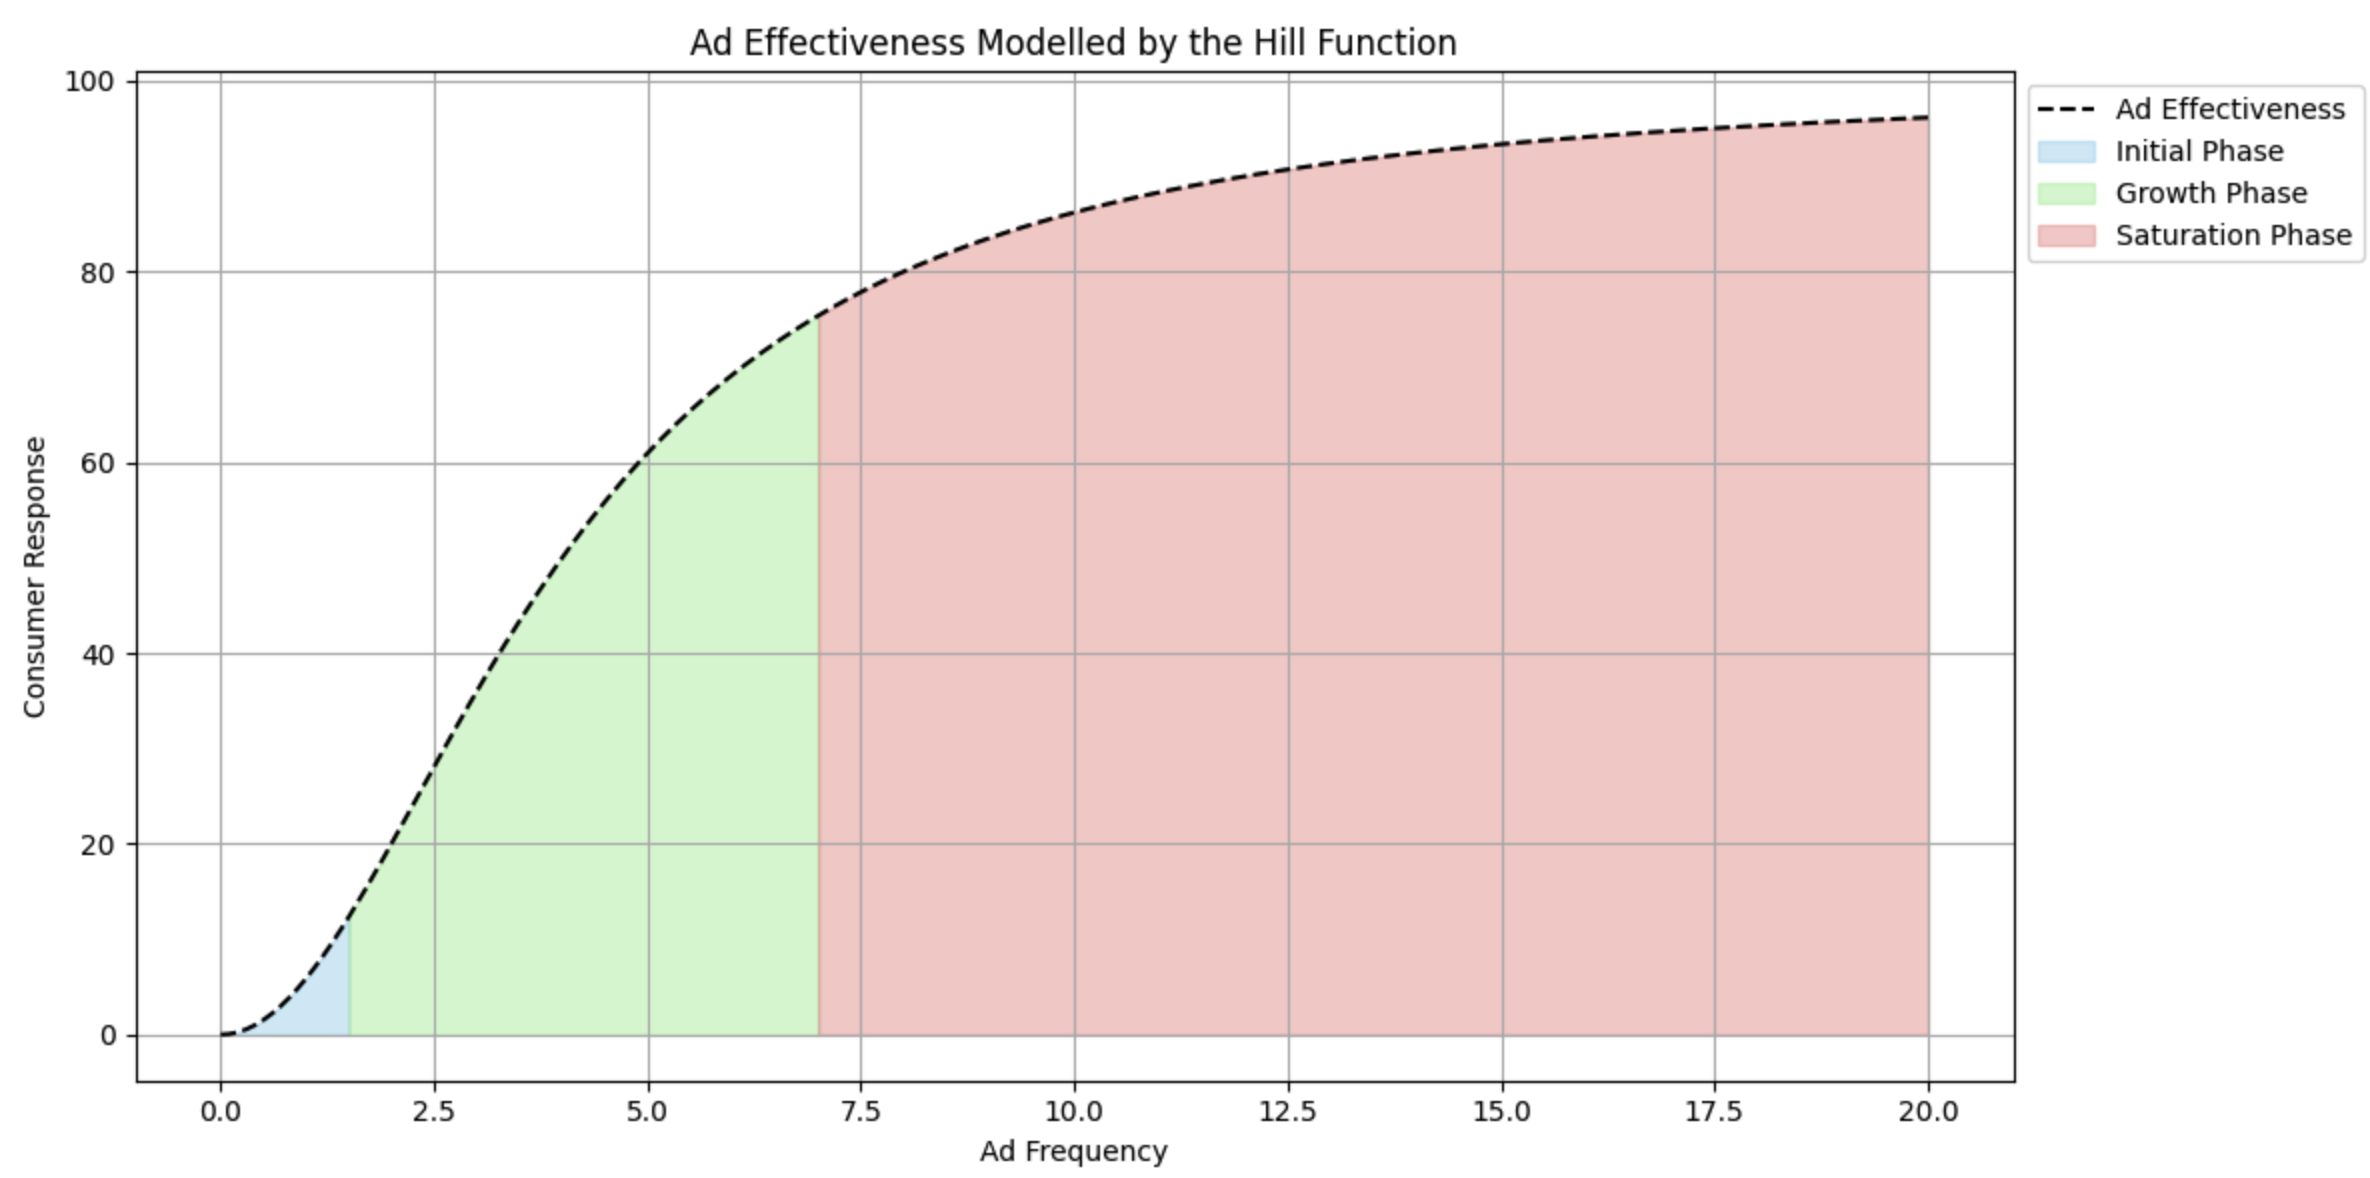
The S-shaped curve produced by the Hill function is particularly advantageous for modeling ad effectiveness as it captures different phases of response:
Initial phase: At low frequencies, the response is minimal. Consumers are just starting to become aware of the ad.
Growth phase: As frequency increases, the response accelerates. Consumers become more familiar with the ad, leading to higher engagement and action.
Saturation phase: At high frequencies, the response plateaus. Additional exposures have diminishing returns, and consumers may even experience ad fatigue.

This reflects a realistic consumer behaviour, the S-shaped mirrors how consumers typically react to repeated stimuli. Initial exposures gradually build awareness, followed by a rapid increase in response as recognition and interest grow. Eventually, further exposures contribute less to the response as the market saturates.
Conclusion
The Hill function provides a powerful tool for modeling the relationship between marketing activities and consumer response. Its ability to produce S-shaped curves aligns well with real-world consumer behavior, offering valuable insights for optimizing advertising strategies. By leveraging this function, marketers can better understand the dynamics of ad effectiveness, enabling more efficient allocation of advertising resources and improved campaign outcomes.
Understanding and applying the right curvature function can significantly help you enhance the effectiveness of your advertising efforts, ensuring that you reach the right balance of frequency to maximize consumer engagement and minimize the risk of ad fatigue.