June 7, 2024 by Cyril Noirot
The Weibull function and its role in modeling marketing investment
In the dynamic landscape of marketing and media evolution, understanding how media efforts drive business outcomes is paramount to success. Marketing Mix Modeling (MMM) comes to the table to help advertisers answer this critical question and goes above and beyond by optimizing the media mix to maximize results. A crucial aspect of this optimization is accurately modeling the response curves that depict how various media channels impact key performance indicators over time.
One powerful tool for modeling these response curves is the the Weibull distribuion. Originally used in reliability engineering and failure analysis, the Weibull function is a versatile statistical distribution that can also be applied to marketing analytics. It is particularly useful for its ability to model different types of response behaviors through its cumulative distribution function (CDF).
Here, we’ll explore how the Weibull CDF can be leveraged as a curvature function in MMM
Weibull function basic
\begin{equation} F(x,\lambda,k) = 1 - exp((-x/\lambda)^k) \end{equation}
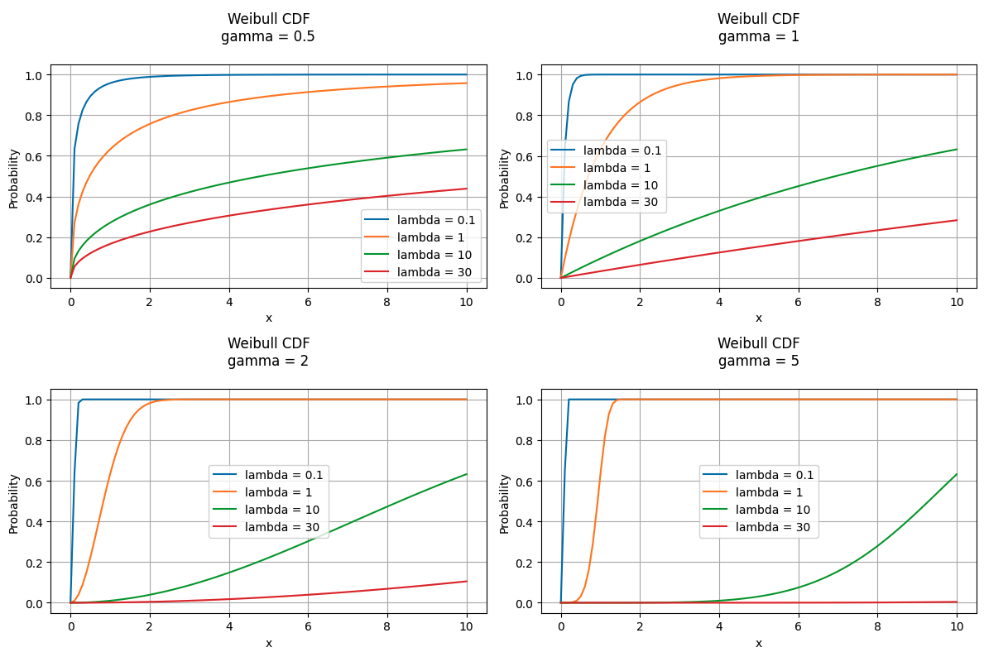
Scale parameter ($\lambda$): This could represent the intensity or the efficiency of a marketing touchpoint. A high lambda indicate a slower sellout rate. Speed at which we reach saturation.
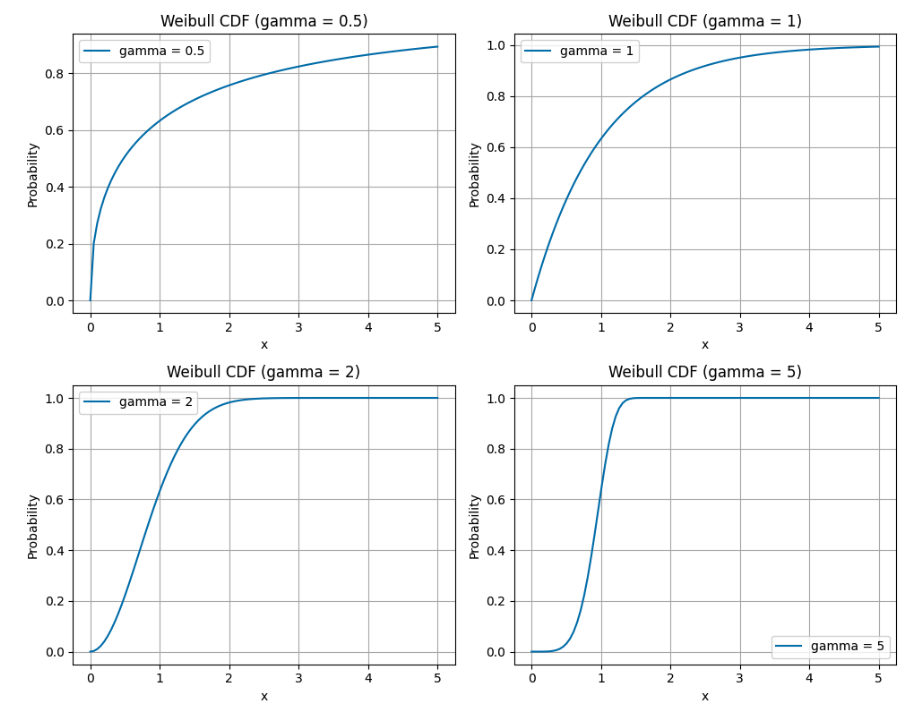
Shape parameter (k): This defines the nature of the curve C shaped or S shaped.
Why the Weibull distribution reflects marketing investment behavior
The Weibull distribution is particularly well-suited for modeling marketing investment behavior due to its ability to capture both saturation and threshold effects by adjusting the shape parameter (k).
Saturation effects: As the investiment on marketing touchpoint increase the incremental effect on sellout diminishes.
Threshold effects: Initial marketing efforts may have little impact until a certain threshold is reached, after which the sellout rate increases rapidly. This is captured by the Weibull distribution’s flexibility in shaping the curve to reflect an initial slow increase followed by a rapid rise in sellout.
Below a graphic which illustrates how changes in the shape parameter,$\gamma$, affect the curvature of the response function, providing insights into different media response scenarios.
Below how changes in the scale parameter $\lambda$ affects the curvature of the response function. The scale parameter will stretches or compresses th distribution.
Actionnable insights from marketing response curves
Marketing response curves typically fall into two categories based on their shape:
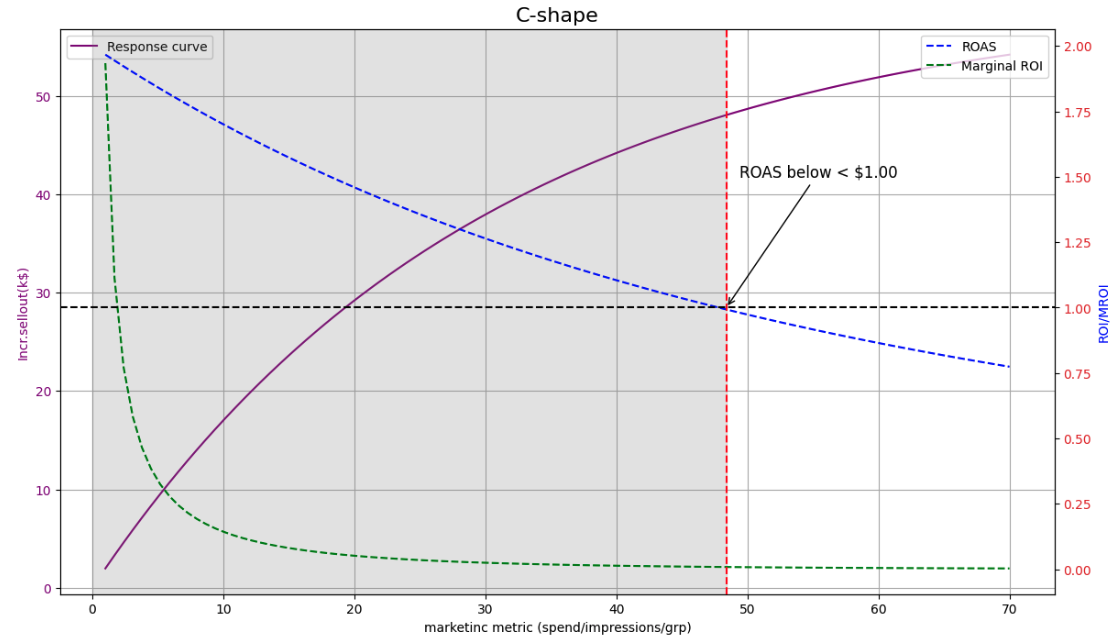
C-shape: These curves represent channels with high initial efficiency, like paid search. This is because customers actively searching for your product are already highly likely to convert.
With a c-shape curve the upper bound for optimal marketing impact is where $ROAS > 1$.

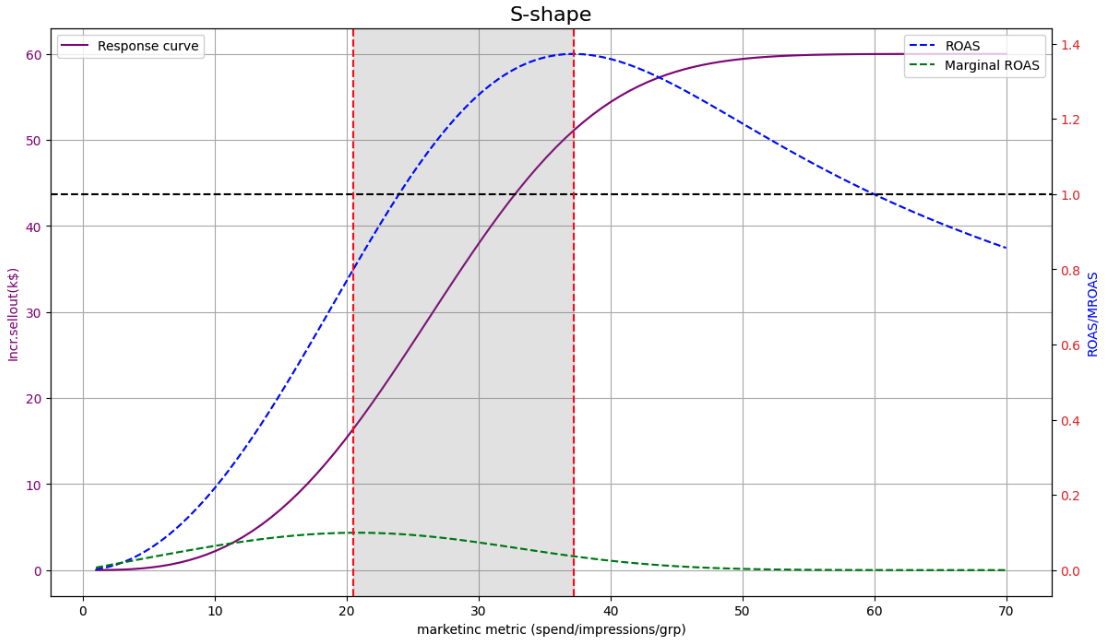
S-shape: These curves represent channels requiring a bigger upfront investment before seeing significant impact. Examples include brand awareness campaigns or social media marketing. These channels build momentum over time, leading to a gradual increase in conversions.
With a s-shape curve the sweet spot has a lower bound.For optimal marketing impact it’s where MROI is maximized and ROI is maximized.

Conclusion
The Weibull function offers a powerful tool for marketers seeking to maximize the impact of their touchpoints. By leveraging its ability to capture curvature, marketers can gain profound insights into channel effectiveness and optimize their strategies for the most significant return on investment (ROI).
However, the optimal curvature function may vary based on your business context. Consider including a discussion with your marketing team to determine if the Weibull function or the Hill function best reflects your specific marketing activities. Examining metrics like Mean Absolute Percentage Error (MAPE) and R-squared within your Marketing Mix Model (MMM) will further guide your decision. This collaborative approach ensures your chosen curvature function and its parameters accurately reflect your data and business objectives, ultimately leading to a more effective and data-driven marketing strategy.

