May 17, 2024 by Cyril Noirot
Geometric adstock decay: How to model marketing lagged effect?
Advertising carryover suggests that the impact of an advertising campaign extends beyond its immediate timeframe, posing unique challenges for marketers. Analyzing the success of a campaign becomes more complex as businesses strive to determine the optimal duration for measuring advertising effects. In this post, we’ll explore how this delayed impact can be model using geometric adstock.
Define geometric adstock
Defintion
The idea of geometric adstock is the following: We consider advertising A(t)$ for t in 1,2,3…T where the time scale are usualy in weeks for MMM. The geometric adstock is defined as:
$$A(t) = A(t) + \lambda * A(t-1)$$
- where $0<\lambda < 1$.This a strong assumptions that garanties that the cumulative sum of the adstock values converges to a finite number.(proof of convergence)
Understanding adstock decay rates in marketing
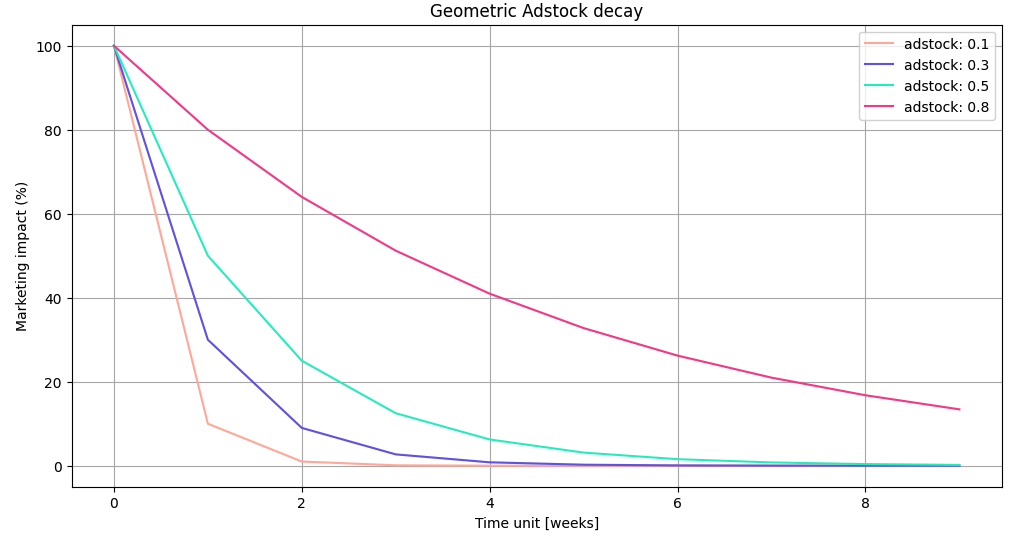
To effectively gauge the enduring impact of marketing activities, it’s illustrative to visualize how the adstock decay rate functions. Consider a scenario where marketing expenditure occurs only in the first week. This setup allows us to observe how the effects of that initial marketing effort taper off over subsequent weeks.
For example, if we apply a decay rate of 0.8, it indicates that in the second week, 80% of the impact from the first week’s marketing activity is still influencing consumer behavior. In simpler terms, if the initial week generated a significant boost in consumer interest or sales, a decay rate of 0.8 means that the second week will still retain 80% of that initial impact.
This concept is crucial for marketers aiming to understand the persistence of their campaigns' effectiveness and to strategically plan the timing and intensity of future marketing efforts.

As data scientist, our key task is to infer this rate by implementing a Marketing Mix Model (MMM). Through MMM, we analyze historical data to determine how different components of the marketing mix contribute to sales and then use this information to predict the effect of future mixes. Identifying the optimal decay rate allows us to create more accurate models that reflect how marketing influences sales over time.
Visualize geometric adstock
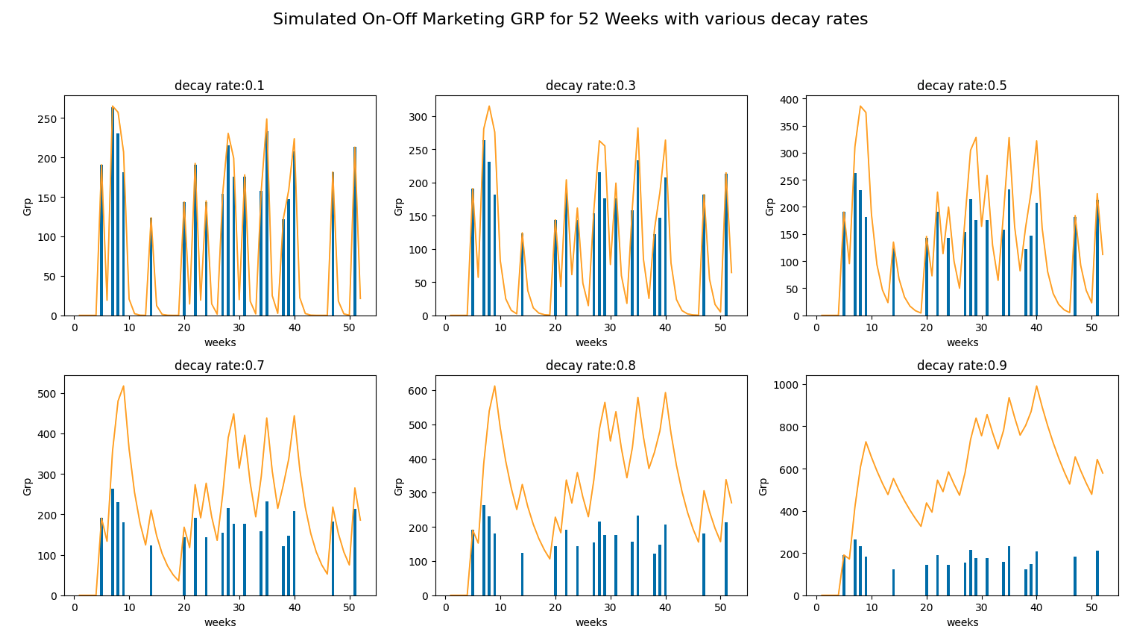
Below is a graphic that helps us understand how marketing activities accumulate over time. The blue bars represent the marketing activity at time $t$, and the orange line represents the carryover impact of previous activities. It’s important to note that the higher the decay rate, the greater the impact of past activities. A decay rate of 1, or greater, it would imply that the impact of marketing efforts does not decay, contradicting observed marketing behaviors where ads' effectiveness tends to drop off over time.

Understanding half-life
It’s very common that marketers communicate half-life rather than decay rate.
The half-life in the context of the adstock formulation is the time it takes for the adstock to decay to half of its value in the absence of new advertising expenditure. In this particular case we have:
$$A(t_{1/2}) = 0 + \lambda* A(t_{1/2}-1)$$ $$A(t_{1/2}) = \lambda * A(t_{1/2}-1)$$
Which in that case become a geometric sequence for which we know the general form : $${\displaystyle a_{n}=a_{m},r^{n-m}.}$$
Therefore
$$A(t_{1/2}) = A_{0} * \lambda ^{t_{1/2}}$$
But we remember that at $t_{1/2}$, $A (t_{1/2}) = \frac{A_0}{2}$
Therefore we then have the equation
$$\frac{A_0}{2} = A_{0} * \lambda^{t_{1/2}}$$
Rearranging to solve for the half-life:
$$\frac{1}{2} = \lambda^{t_{1/2}}$$
Finally for the geometric adstock we have the following relationship between half-life and decay rate:
$$ t_{1/2} = \frac{\log(0.5)}{\log(\lambda)}$$
Which can also be written as follow $$\lambda = 0.5^{t_{1/2}}$$
Average media half-life
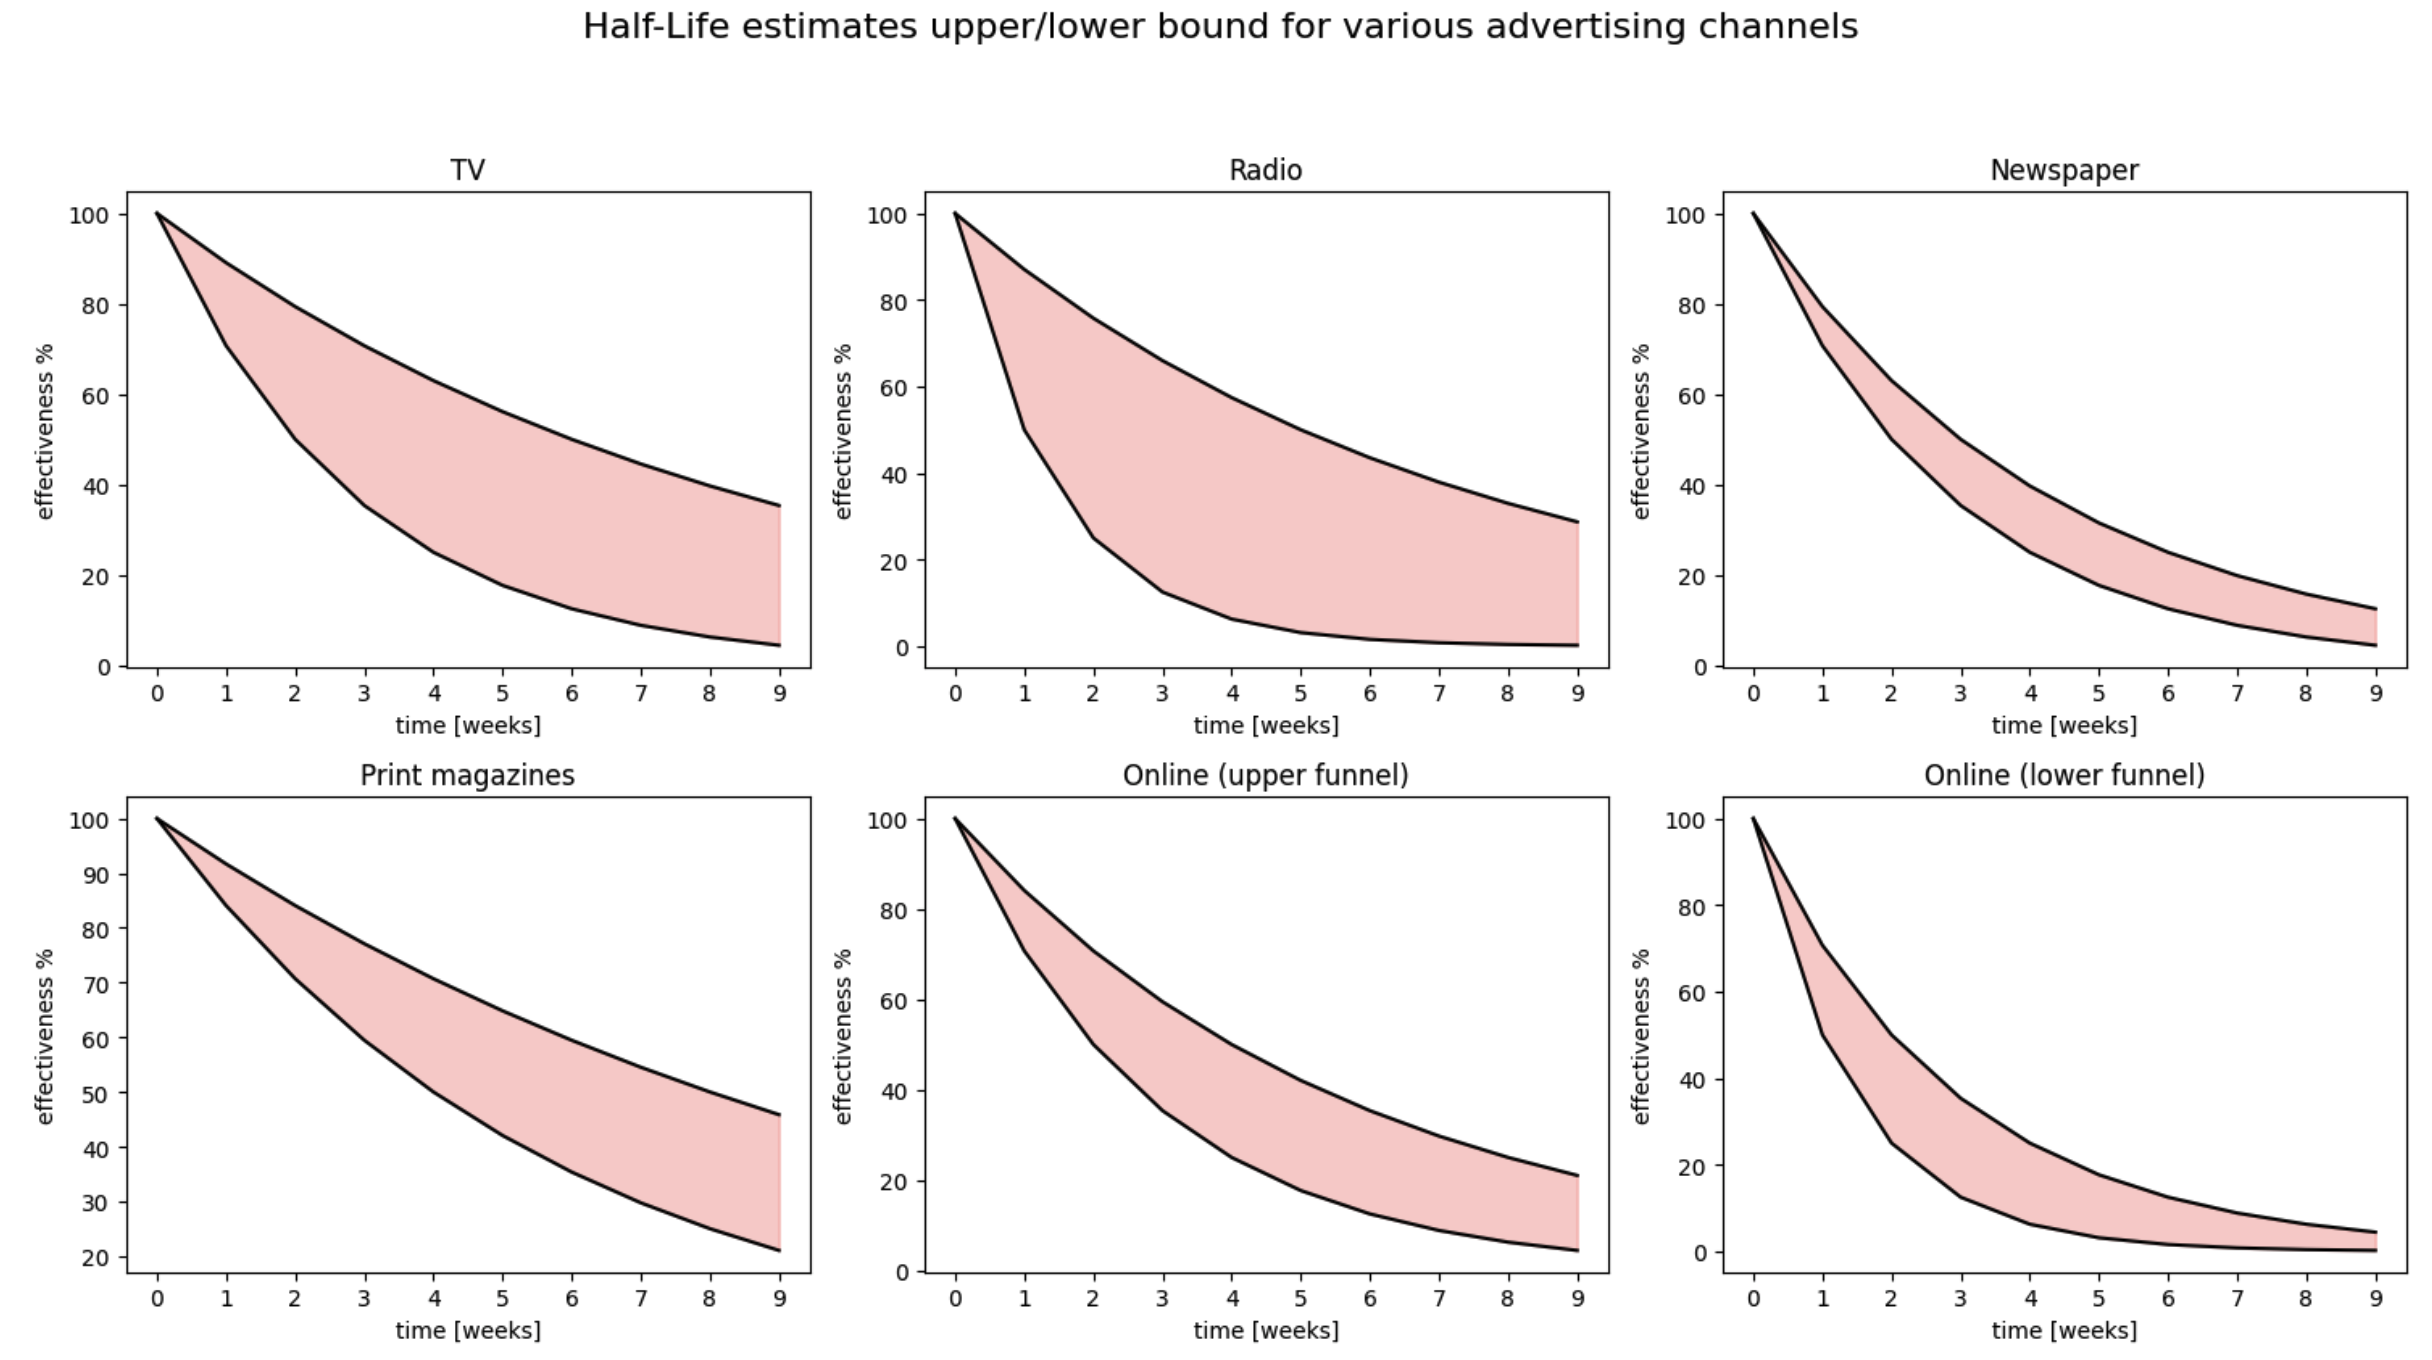
Some common benchmark for marketing half life touchpoint can be seen below:
| Channel | lower bound (week) | upper bound (week) |
|---|---|---|
| TV | 2 | 6 |
| Radio | 1 | 5 |
| Newspaper | 2 | 3 |
| Print magazines | 4 | 8 |
| Online (upper funnel) | 2 | 4 |
| Online (lower funnel) | 1 | 2 |

Channels with longer half-lives (like TV and Print Magazines) maintain their effectiveness for a longer period compared to others. TV has a broader range of effectiveness compared to others, showing a relatively slow decline.
Online (lower funnel) and Newspaper show the fastest decline in effectiveness, indicating they might be best used for short-term campaigns. The narrow range indicates a consistent decline among different newspaper campaigns.
The Radio and online (upper funnel) channels fall somewhere in between, showing moderate half-life durations.
The effectiveness of media can wear off quickly depending on the industry and the creativity of the content.
References
- Wikipedia contributors. (2024, 25 avril). Advertising adstock. Wikipedia. https://en.wikipedia.org/wiki/Advertising_adstock
- Mikes, M. (2019, 20 février). Advertising adstock theory - Marko Mikes - Medium. Medium. https://medium.com/@Marko_Mi/advertising-adstock-theory-85cc9e26ea0e