July 10, 2024 by Cyril Noirot
Drivers of insurance premiums
Insurance premiums are influenced by a range of customer attributes, from age to smoking habits. Understanding these drivers is critical for insurance companies to craft personalized pricing strategies while maintaining fairness. In this blog, we’ll extract actionable insights using a simple linear regression and some Monte Carlo simulations.
What is an insurance premium?
An insurance premium is the periodic payment you make to an insurance company in exchange for coverage, with the cost tailored to your individual risk profile. Insurance companies calculate this fee by considering factors such as your age, health factors, location, family situation, type of coverage, coverage amount etc, essentially charging you a personalized price that reflects the likelihood and potential cost of future claims.
Why this matters for Insurance company?
- Personalized pricing: Tailor premiums to customer profiles while ensuring transparency and trust.
- Fair risk assessment: Quantify the incremental impact of different factors
- Data-driven decision making: Equip stakeholders with clear, visual insights to refine pricing models and strategy.
The dataset
We analyze a dataset of 1,338 records from a US health insurance provider, key variables include:
- age (continuous) - customer’s age..
- bmi (continuous) - Body Mass Index, a measure of health risk.
- children (discrete) - The number of children.
- sex (categorical/binary) - customer’s gender.
- smoker (categorical/binary) - binary indicator of smoking status..
- region (categorical) - The region where the insured lives.
- charges (float) - insurance premiums.
Our goal:
Quantify the impact of age and smoking status on insurance charges, leveraging both traditional linear regression and Monte Carlo simulations.
Method
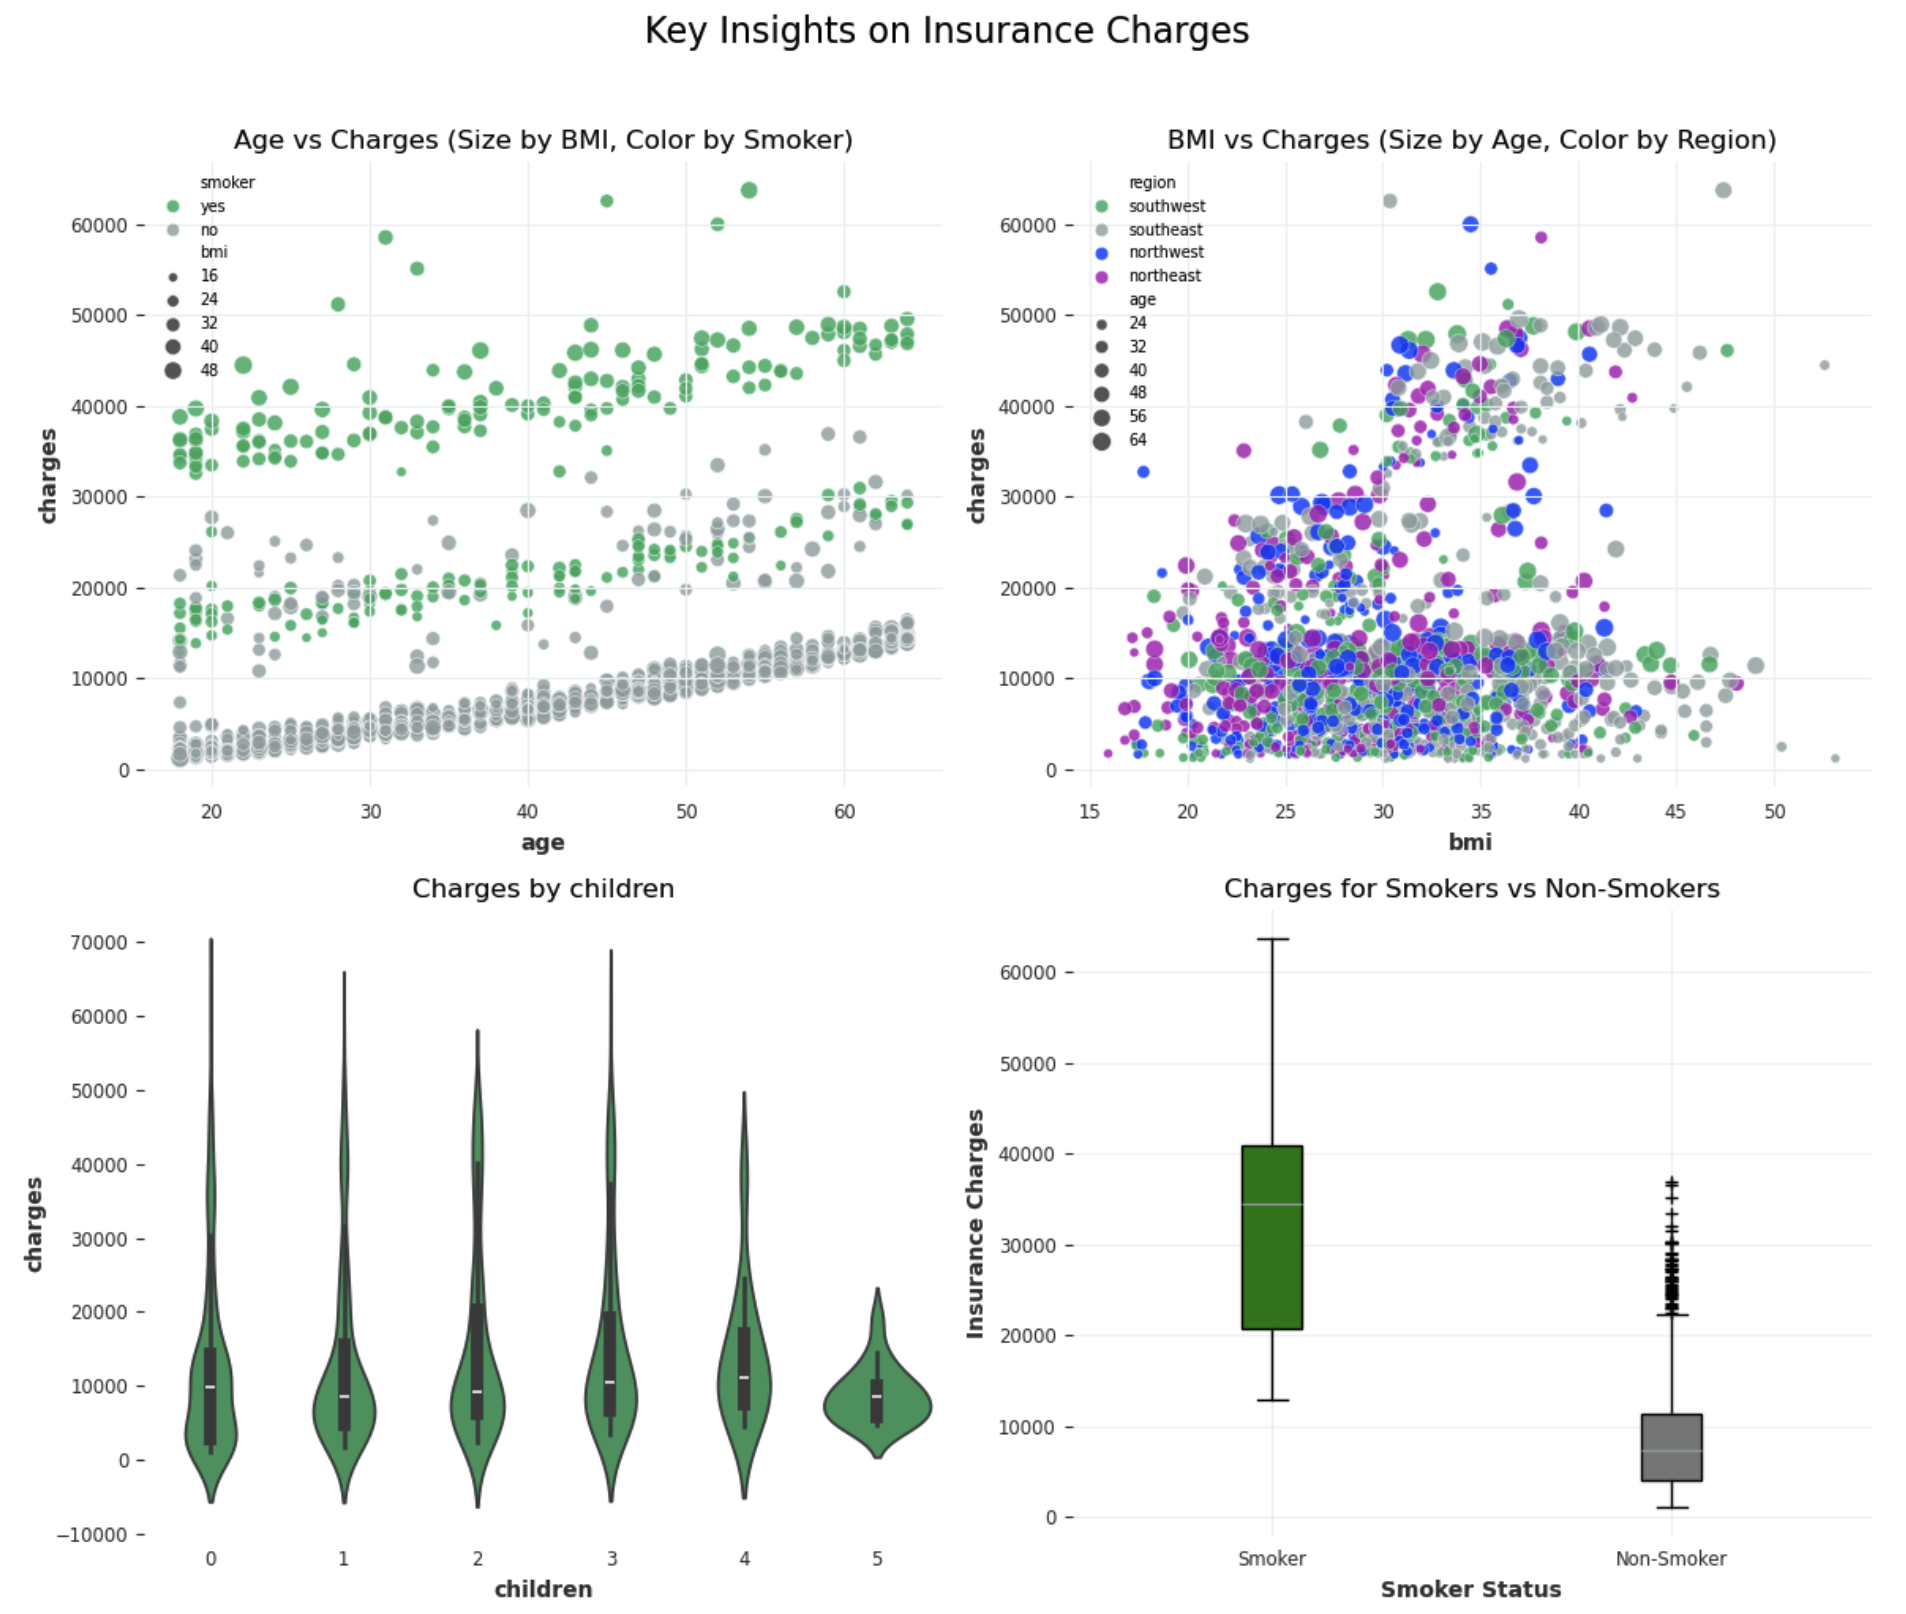
Let’s create some visualizations to identify the most significant variables influencing insurance charges,
Variable impact on insurance premium

Variable distribution
Age distribution highlights a mix of young and older populations, suggesting opportunities for age-specific premium models.

Correlation
- smoker_encoded, age, and bmi as priority variables for predicting charges due to their significant correlations.
- Features like children and sex_encoded could be tested for removal if they do not improve model performance during evaluation.

Machine learning pipeline: predict insurance premium
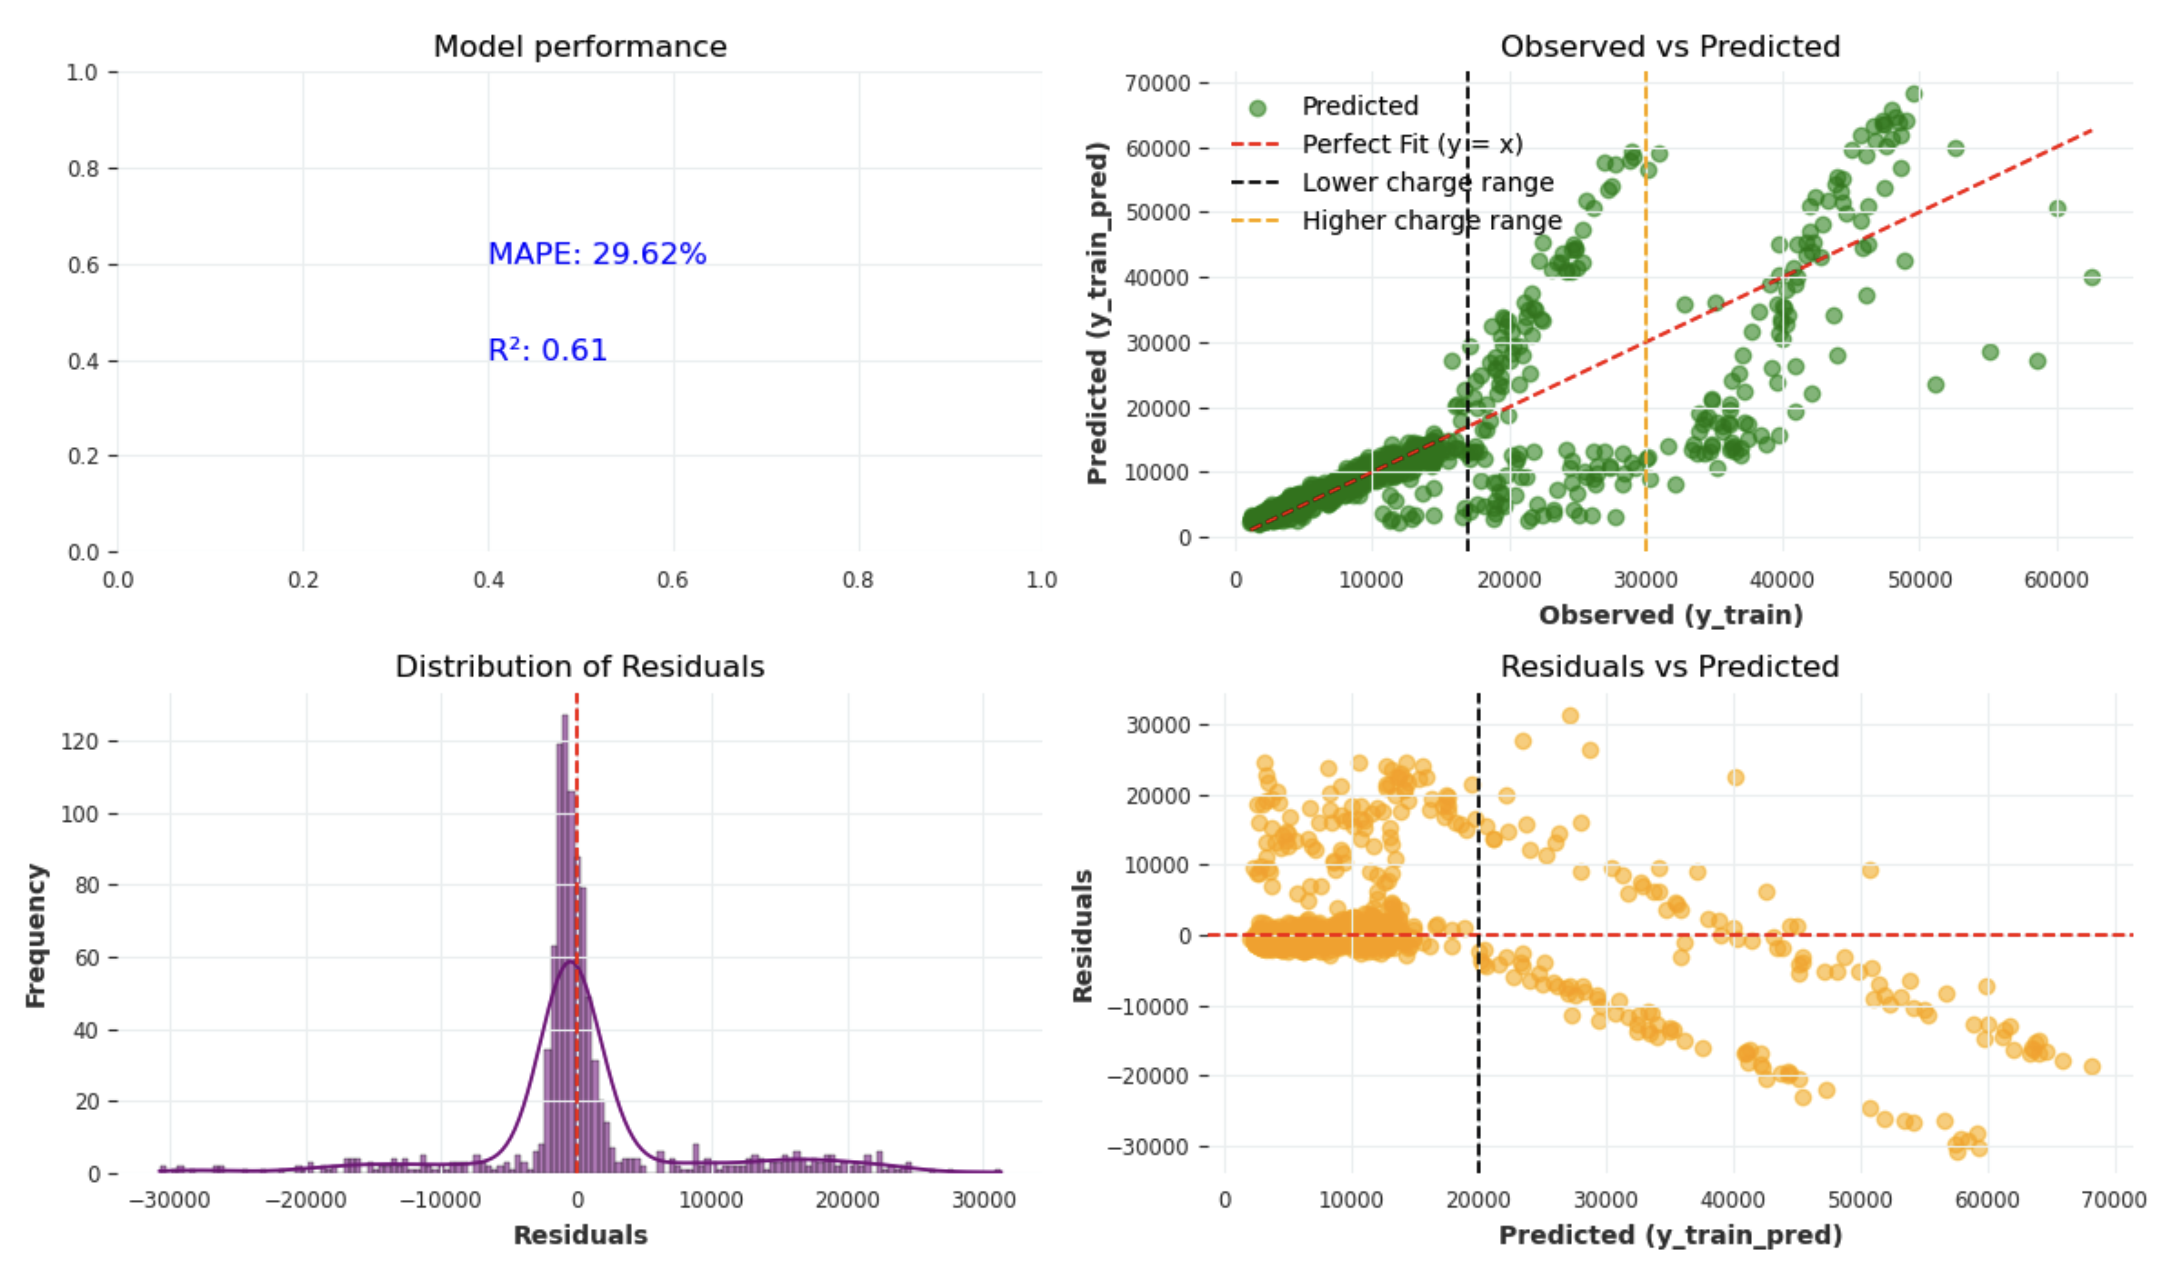
Our machine learning pipeline consists of a preprocessing step where numeric features undergo log transformation and standardization, while categorical features are passed through unchanged, followed by a Linear regression model for predictions.

Overall fit: The red dashed line represents the ideal scenario where predicted values perfectly match the observed values (y = x). Most predictions, in the low-to-moderate charge range (below 15000) , align reasonably well with this line, the model captures the general trend of the training data.
Systematic underprediction: In the higher charge range (above 30,000), predicted values predominently fall below the actual values (observed): the model struggles to predict very high charges accurately,
The model’s performance shows room for improvement, with an $R^2$ of 0.61 and a MAPE of 29.62%. We could consider exploring decision tree architectures or enhancing feature engineering to achieve better predictive accurac y.

Simulation pipeline: quantifying the financial impact of smoking.
By generating synthetic datasets with stochastic variations while preserving key statistical properties, we create a robust framework for counterfactual analysis providing a probability distribution of outcomes. The probabilistic prediction pipeline leverages our pre-trained linear regression model to:
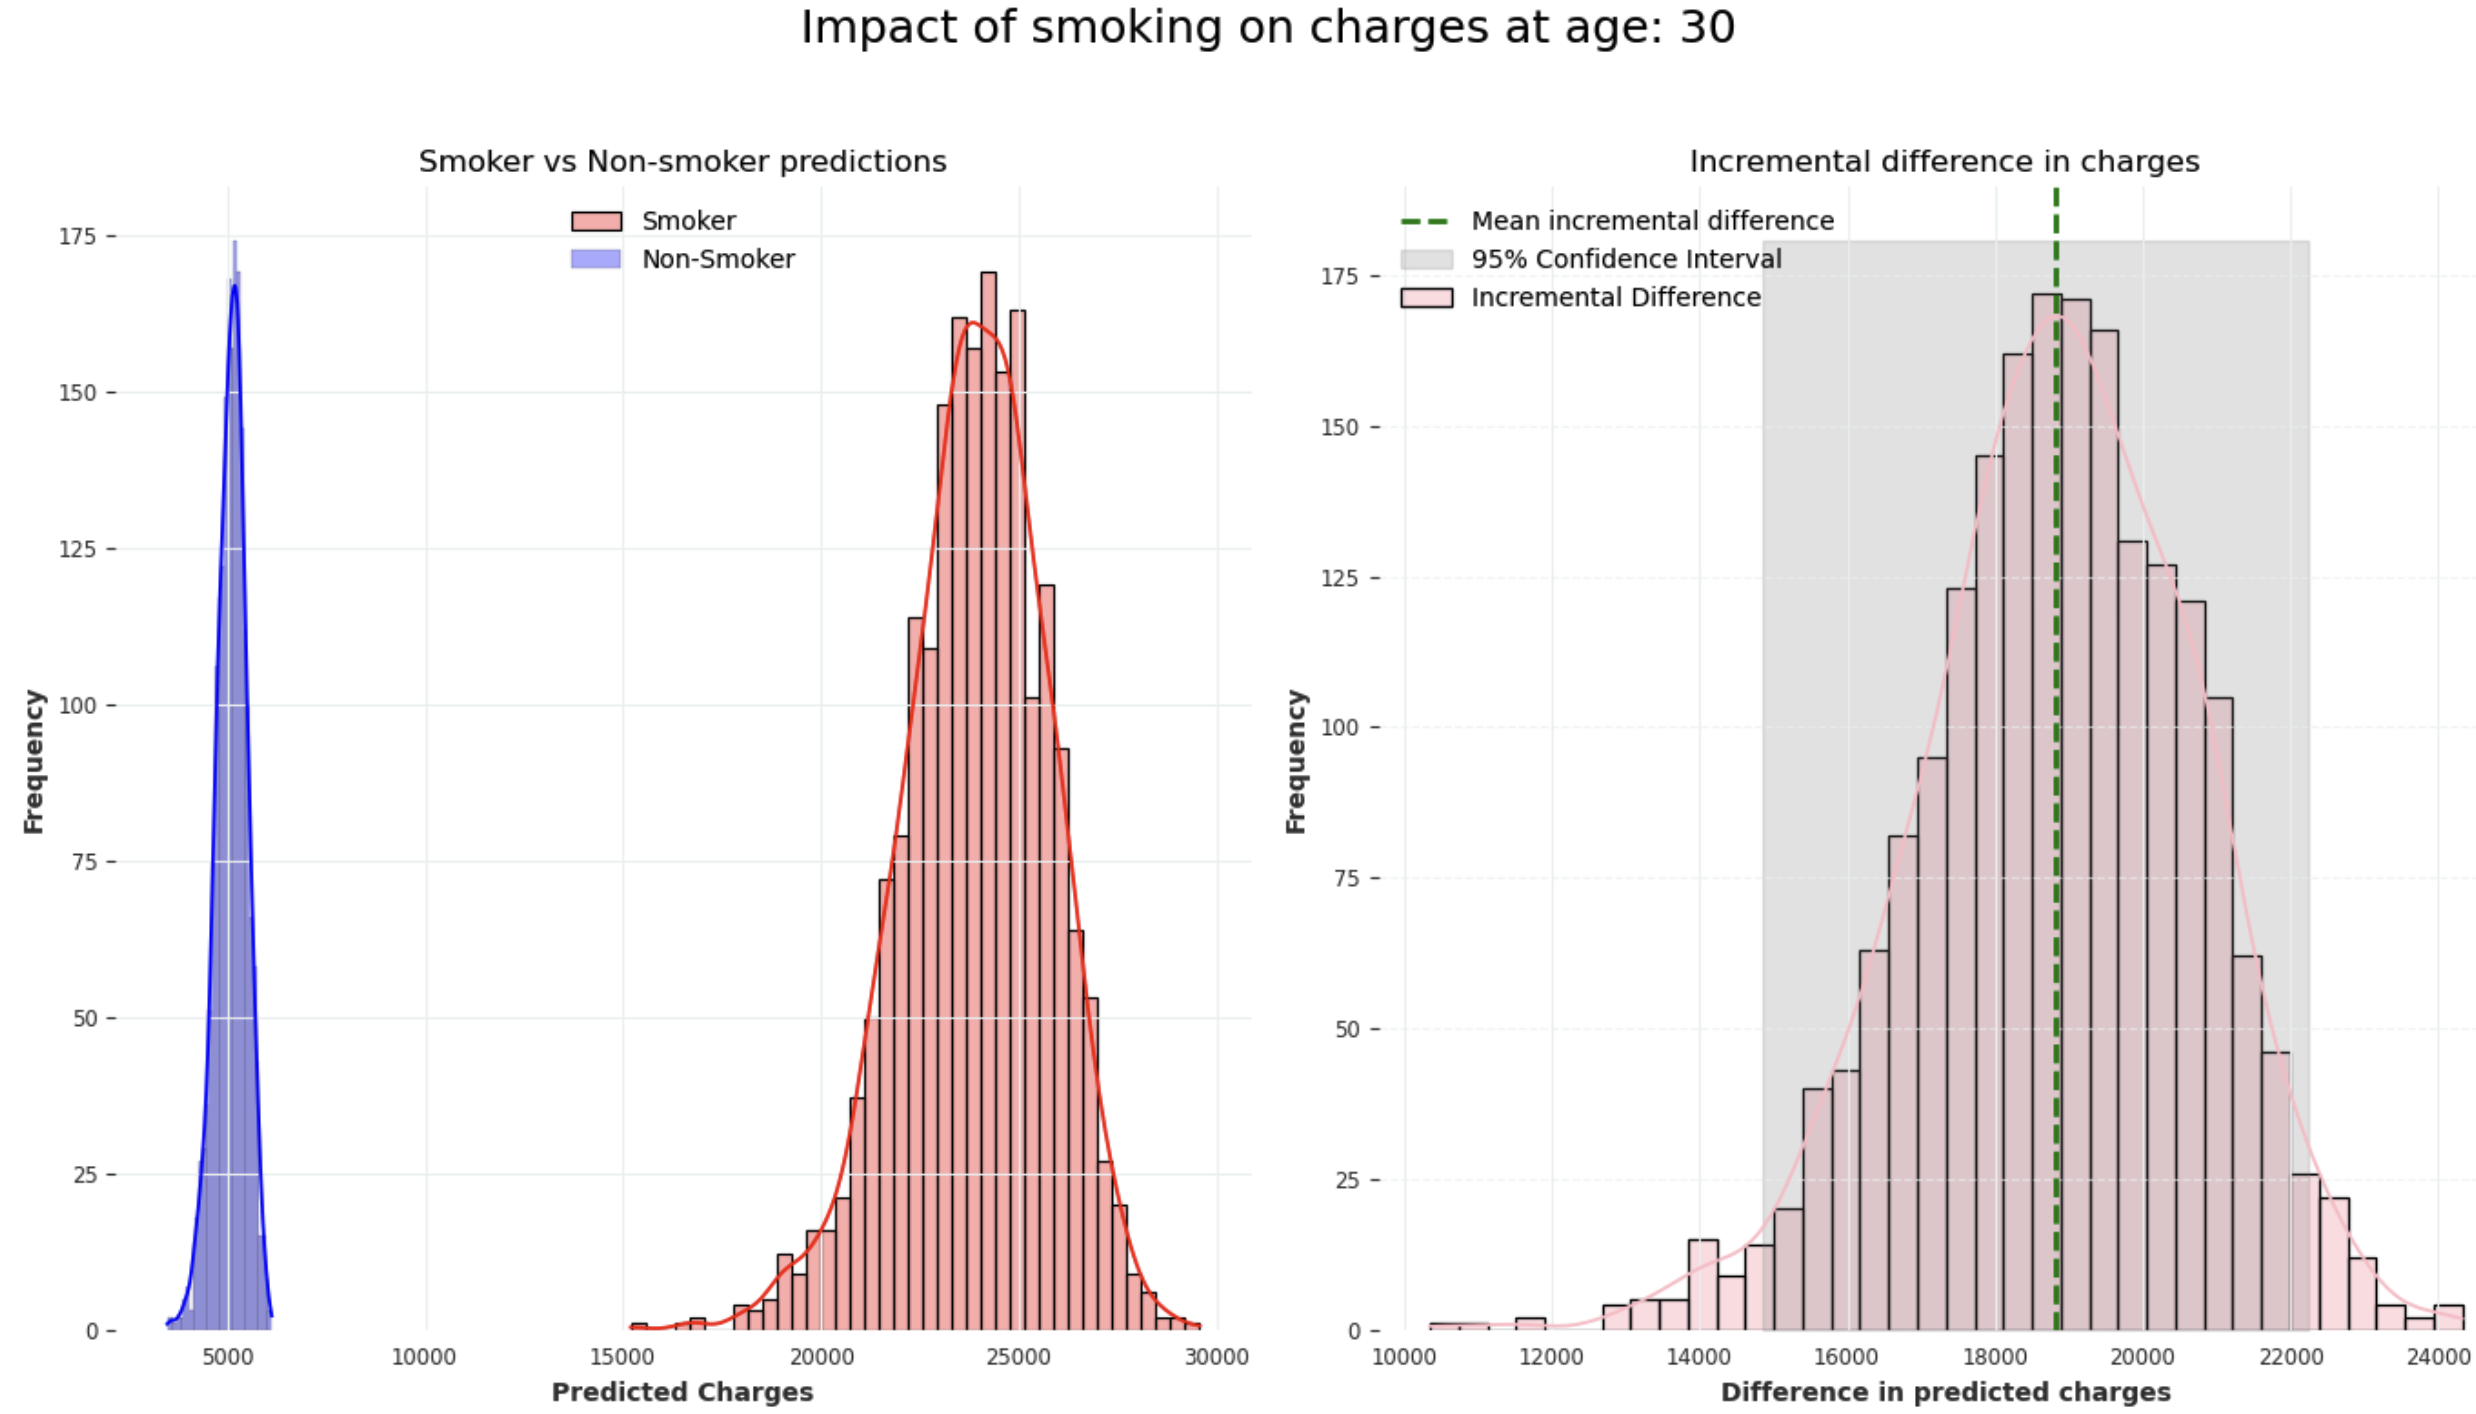
Generate predictions for simulated smoker and non-smoker populations at age 30
Compute distributional differences between these populations

At age 30, our simulation demonstrates that smokers, on average, incur an additional charge of 18,823.96 compared to non-smokers. The estimated incremental difference is accompanied by a 95% confidence interval ranging from 14,852.74 to 22,253.82, reflecting the variability in predictions across our model.
Results
Our analysis combines machine learning prediction with probabilistic modeling to quantify the financial impact of smoking on insurance charges. Rather than relying on simple averages, our approach reveals the full distribution of cost differences between smokers and non-smokers, providing richer insights for decision-making.
The results clearly demonstrate that smoking significantly drives insurance costs upward. This finding has immediate practical applications: insurers could develop targeted wellness programs or smoking cessation incentives to reduce both health risks and costs for their policyholders.
However, the model’s current performance, with a low R^2 and high MAPE, indicates room for improvement before advancing further. Future analyses could explore the impact of other variables, such as BMI, or interactions like BMI and age, depending on the specific business needs.
References
- Folger, J. (2023, 16 décembre). How to Calculate Insurance Premiums. Investopedia. https://www.investopedia.com/ask/answers/09/calculating-premium.asp